
How has energy consumption changed during the COVID-19 pandemic? This is a question that researchers in the Department of Electrical and Computer Engineering at Texas A&M University are hoping to answer. Dr. Le Xie, professor in the department, and his team and collaborators have created a first-of-its-kind cross-domain, open-access data hub to track the impact of the pandemic and subsequent social distancing and work-from-home policies on U.S. electricity markets.
Published in the September issue of Joule, a prestigious academic journal focused on bridging diverse disciplines of energy research, the Coronavirus Disease – Electricity Market Data Aggregation+ (COVID-EMDA+) hub combines data across disciplines that showcases how human and environmental habits have impacted electricity usage.
There’s a lot to take into account when it comes to electricity consumption related to a pandemic, and data hubs similar to this one have already been attempted. So, what makes this one different? The difference is that COVID-EMDA+ incorporates seemingly extraneous information that turns out to be quite important to our understanding of the impact of the pandemic on the electricity sector.
The data hub contains five major components: electricity market data, public health data, weather data, mobile device data and nighttime light satellite data.
“Weather definitely affects electricity usage,” said Xie. “For instance, Texas had quite a hot summer. So, although everyone was quarantining inside, the month of August saw a surge in energy consumption from air conditioners.”
The GPS location of mobile devices, a dataset that has never before been used in the analysis of the electricity sector, helps illustrate patterns in mobility. How many people are social distancing versus how many people are still visiting shopping centers?
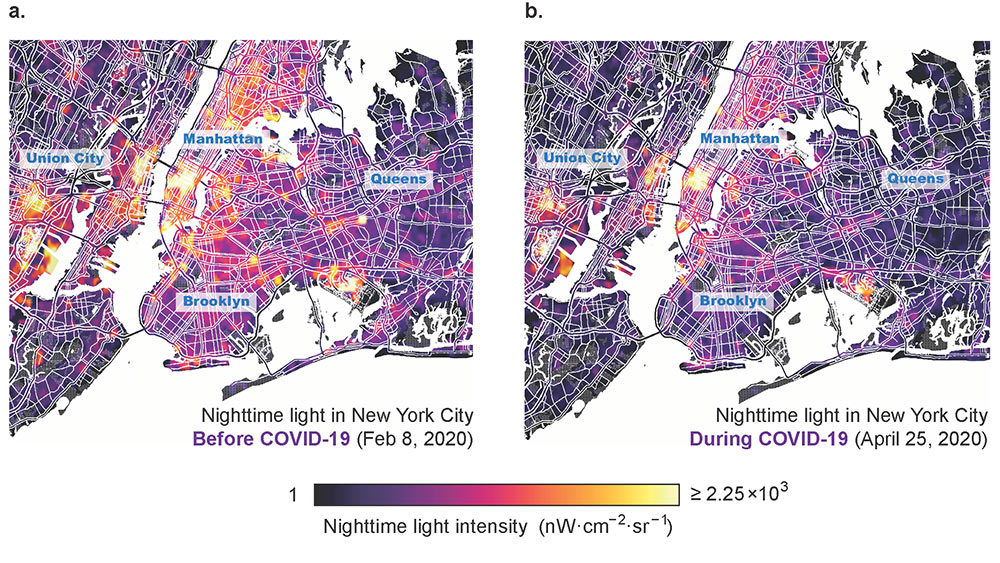
The phenomenon of human mobility became an even greater factor to understanding electricity consumption once NASA published nighttime satellite images of large cities. When looking at images of Houston and New York City lit up at night from before and during the COVID-19 pandemic, the stark contrast is clearly visible. In Manhattan alone, the city light at night was dimmed by about 40% between February and April. This meant that as quarantine progressed, fewer people were venturing outside in the evenings for a romantic dinner for two, a family movie night or a visit to the shopping malls. Less human mobility meant less electricity needed to keep the busy cities lit.
Their research uncovered a key finding: mobility is a strong indicator of electricity consumption changes. “In New York, the strongest indicator of electricity consumption is the visits to the retail sector – the shopping malls and grocery stores,” said Xie. “We didn’t realize how much that impacts electricity consumption.” When visits to the retail sector decrease, electricity consumption plummets.
Moving forward, Xie hopes to incorporate data regarding socioeconomic status to shed more light on how the pandemic has impacted economically disadvantaged communities. “Someone who works minimum wage on an hourly basis will be affected much differently than someone who does not have to worry about their next paycheck,” said Xie. The hub can serve as a unique lens to examine questions related to socioeconomic disparities and hopefully uncover areas of energy poverty, where families may have trouble accessing reliable and affordable energy.
The data hub is updated daily after careful quality control to provide the most up-to-date information to the public. Xie and his team hope this data hub can serve as an open-access tool for system operators, as well as for state and federal policy makers. Not only will it help policymakers make more informed decisions when it comes to allocating resources, but it will also help society become more aware of how much energy we consume and how we consume it.
“It helps everyone to be more energy conscious and cognizant, especially during this once-in-a-lifetime societal crisis,” said Xie.