Pressures, liquids and temperature changes create cracks in rock and concrete over time. These cracks can grow and combine into networks, eventually reducing solid materials into rubble. While this is a natural process of erosion, it is not well documented because it is not always visible when it’s happening. Yet cracks are important in allowing fluid to flow in oil and gas production and critical to avoid in man-made structures.
Texas A&M University researcher Dr. Siddarth Misra was given a $548,099 grant from the Department of Energy (DOE) to use technology and machine-learning analysis on provided data measurements to portray the evolution of cracks in solid material so the destruction can be classified even when visibly hidden. This research could have multiple applications, such as benefitting oil and gas energy production, geothermal applications and even nuclear waste storage monitoring.

“The three-year project involves accurately depicting the destruction of cracks in rock, or illustrating the mechanical discontinuity of material,” said Misra, associate professor and Douglas Von Gonten Faculty Fellow in the Harold Vance Department of Petroleum Engineering. “Cracks initiate, grow, propagate, combine, coalesce and cluster, but it’s difficult to see what’s going on inside solid rock or concrete to know what stage of crack is there.”
Picture a rock striking a car windshield and starting a tiny crack. Wind, sun and water encourage the crack to grow. When more cracks form, they meet and intersect, separating the glass into smaller and smaller sections that eventually fail to hold the overall shape. The stages of cracks in rock and concrete are similar but do not form smooth paths like those in glass. Plus, rock fractures grow three-dimensionally, meaning a few surface cracks could indicate far more damage underneath that cannot be seen.
“We can’t just guess what is going on,” said Misra. “We can’t always cut the rock apart to see. Our approach to the problem uses data from different sources to explain what has actually happened.”
The research project uses multiple types of measurements, from sound, electromagnetics and pressure sources, to gather the necessary data.
The first phase will involve supervised learning on standard samples where the cracks have already been measured and classified. Misra’s team is collecting these samples from other DOE test sites that completed the electromagnetic and pressure measurements.
As his team performs the sound tests and receives the measurement data sets from the other test sites, they are instructing Misra’s machine-learning software how to merge these different sources of information together and filter the results. This will refine the information and teach the software to understand each stage of damage.
The second phase of the project, unsupervised learning, uses the same types of measurements but on unclassified samples to see if the software can recognize the data set patterns and accurately sort the crack stages by itself.
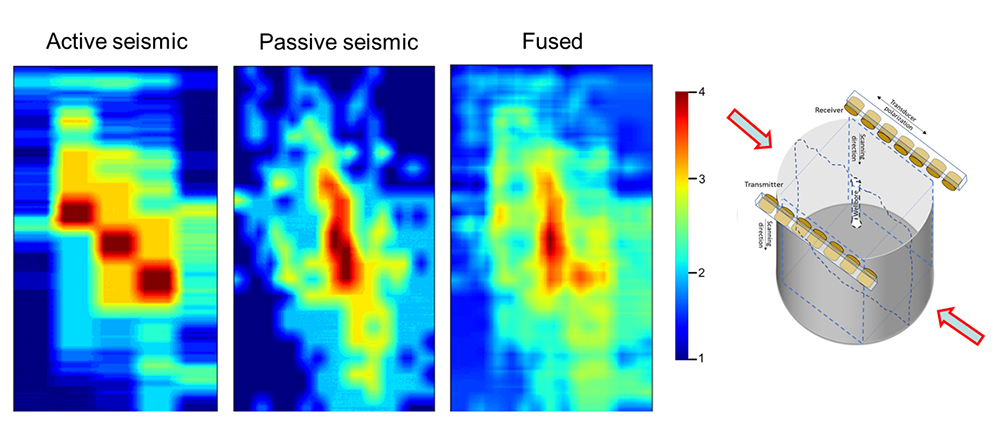
Misra and his student researchers gathered the acoustic data by taking measurements produced by sound waves. They not only used multiple angles to measure samples, they also used different types of sound to produce the best data sets possible.
“Sound traveling through rock gives us an active acoustic data set,” explained Misra. “But the rock also produces sound as it cracks, giving us passive acoustics.”
One month in, the results are already showing promise. When the software learned how to fuse both active and passive acoustic data sets, Misra’s team found it could use the same math that reduces unwanted noise in photo images to improve the clarity of the sound data and generate 3D visuals of the cracks.
“This approach of using multiple measurement sources is unique,” said Misra. “When we combine all the sources of data, the software will be capable of robust 3D representations of crack damage. Then we can develop the predicted workflows where we only need provided data to visualize and categorize cracks.”